Since all data processing in the Zantiks units is performed live, it is necessary to outline which data you would like to be processed and how this data will be exported in zanscript.
This page will explain how to use the LOGCREATE, LOGDATA and LOGRUN commands in script to allow you to download summarised arena data from your unit after the behavioural experiment has finished.
We will provide two examples: one for multiple arenas and another for a single arena. For multiple arenas, we have provided the example of a multi-well plate in the MWP system. For a single arena we are using the example of an LT or AD tank/cage. The script writing is compatible across all Zantiks systems and not limited to the system shown in the example. To understand how to export data in multiple zones within an arena, you can refer to the support page on Writing and exporting zones data.
Whilst familiarising yourself with scripting, it is advisable to use the scripts below in tandem with the Zanscript syntax manual.
Script explanation, multiple arenas
NOTE: before running this experiment you will need to ensure you have loaded the appropriate asset. The asset will be a bitmap file (.bmp) which must be loaded into your 'Assets Driectory'. The MWP unit holds a petri dish, or multi-well plates. Examples of the .bmp files can be seen below.
More information on how to build appropriate assets for your experiments can be found in the Zanscripts & services manual.


The example below explains how to export distance travelled data for larval zebrafish in a 24-well plate. This script can easily be adapted for a petri dish up to a 96-well plate.
DEFINE TIME_BIN 1
DEFINE NUM_SAMPLES 60

SET(TARGET_SIZE,2)
SET(DETECTOR_THRESHOLD,6)

SET(AUTOREF_MODE,MOVEMENT)
SET(AUTOREF_TIMEOUT,10)

DEFINE X_DRAWTRACKS 30011
DEFINE X_TRACKTIME 30016
- The first two DEFINE commands assign values to text used later in the script.
- The following two SET commands are used for tracking zebrafish larvae. Suggested settings for different model organisms can be found under the support page for tracking settings.
- The next two SET commands define the autoreference which is required for tracking.
- The final two DEFINE commands are required for drawing track traces.
ACTION MAIN

 SET(COUNTER1,COUNTER_ZERO)

 LOAD(ARENAS,"a24.bmp")

 LOGCREATE("TEXT:RUNTIME|TEXT:TEMPERATURE|TEXT:TIME_BIN|TEXT:VARIABLE")

 LOGAPPEND("TEXT:A1|TEXT:A2|TEXT:A3|TEXT:A4|TEXT:A5|TEXT:A6")
 LOGAPPEND("TEXT:B1|TEXT:B2|TEXT:B3|TEXT:B4|TEXT:B5|TEXT:B6")
 LOGAPPEND("TEXT:C1|TEXT:C2|TEXT:C3|TEXT:C4|TEXT:C5|TEXT:C6")
 LOGAPPEND("TEXT:D1|TEXT:D2|TEXT:D3|TEXT:D4|TEXT:D5|TEXT:D6")
 LOGRUN()

 AUTOREFERENCE()
 SET(X_DRAWTRACKS,1)

 INVOKE(SAMPLE,NUM_SAMPLES)

COMPLETE
The ACTION MAIN outlines the whole experiment:
- SET(COUNTER1,COUNTER_ZERO) labels a counter as counter 1 and asks the system to begin the counter at 0
- LOAD(ARENAS,"a24.bmp") loads the bitmap file for the 24-well plate which needs to be in the 'Asset Directory'. The bitmap outlines the size, shape and position of each of the arenas to be used in the experiment.
- The LOGCREATE, LOGAPPEND and LOGRUN commands can be used to write the headings which will be on the exported data file.
- LOGCREATE specifies writing (or logging) of data. The LOGCREATE (and subsequent LOGAPPEND) command tell the unit to commit to memory information for a line of data.
- There is a character limit in Zanscript of 170 (previous software versions may have up to a 78 character limit). To continue writing a single line of data, LOGAPPEND can be used. In the example above, a heading label has been written for each of the arenas as they would be read on a 24-well plate.
- LOGRUN tells the unit to output the above data into the .csv file
NOTE: The TEXT command in these lines of text ask the system to write whatever text follows "TEXT: " if this is left empty then the cell in the exported data file will be empty. The "|" indicates the next column of data.
- The following commands take the autoreference and start drawing tracks, then INVOKEs the action SAMPLE which is outlined in detail in the script below. The action SAMPLE is repeated a number of times as DEFINED by NUM_SAMPLES at the top of the script.
ACTION SAMPLE

 SET(COUNTER1,COUNTER_INC)

 LOGDATA(DATA_SNAPSHOT,"begin")
 WAIT(TIME_BIN)
 LOGDATA(DATA_SNAPSHOT,"end")

 LOGDATA(DATA_SELECT,"begin")
 LOGDATA(DATA_DELTA,"end")

 LOGCREATE("RUNTIME|TEMPERATURE1|COUNTER1|TEXT:TOTAL_DISTANCE")
 LOGAPPEND("ARENA_DISTANCES*")
 LOGRUN()

COMPLETE
These commands outline the action called SAMPLE:
- The counter labelled COUNTER 1 is set to count incrementally
- LOGDATA(DATA_SNAPSHOT, "begin") tells the unit to take a snapshot of the experiment, remembering the tracking details of the animals, and labelling this snapshot BEGIN.
- The system then WAITs for a period of time in seconds DEFINED as TIME_BIN at the top of the script.
- LOGDATA(DATA_SNAPSHOT, "end") makes another log of the tracking data after the TIME_BIN and calls this data "end".
- The following LOGDATA commands (DATA_SELECT,"begin") and (DATA_SELECT,"end") instructs the unit to calculate the difference between "begin" and "end".
- The final LOGCREATE, LOGAPPEND and LOGRUN() commands specify the content for a row of data and outputs it into the .csv file. In this case:
- The units runtime can be input using the command RUNTIME
- TEMPERATURE1 inputs the temperature reading from thermistor 1
- COUNTER1 will input the time bin
- TOTAL_DISTANCE has been written as text
- ARENA_DISTANCES asks the system to calculate the distance travelled and the * asks fo the unit to do this for all arenas outlined by the bitmap file.
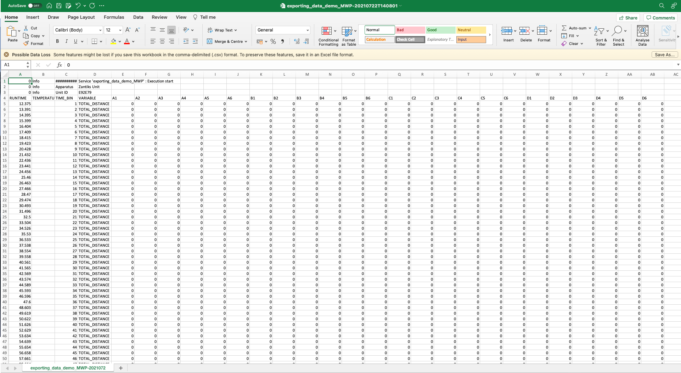
Results Output, multiple arenas
The image below illustrates how the results data file will be output for the above script. NOTE: no animals were used for this demo so all distances are recorded as 0.
Script download, multiple arenas
To download the exporting_data_demo_MWP script as a .zs file (file type Zantiks software reads), choose the Save File As option in the right-click dialogue box. Clicking on the script name hyperlink will open a read-only version of the script.
Script download: exporting_data_demo_MWP.zs
Assets
You will need to upload the asset into the Asset directory on your Zantiks Control Console and ensure the correct asset name is in the LOAD(ZONES,"name_of_asset") command in the script.
See the Calibrating your Zantiks unit page and Asset building in the MWP unit page for details on how to create assets customised to your system.
Script explanation, single arena
The following example shows how the LOGCREATE, LOGDATA and LOGRUN commands can be used in a script for a single tank/cage in the AD or LT unit. In this example the entire tank is used. Therefore the script does not include lines for loading assets. When no asset is loaded the system will use the entire camera view as the arena.
DEFINE TIME_BIN 5
DEFINE TRIALS 3

SET(TARGET_SIZE,15)
SET(DETECTOR_THRESHOLD,5)

SET(AUTOREF_MODE,MOVEMENT)
SET(AUTOREF_TIMEOUT,30)
- The first two DEFINE commands detail values used later in the script.
- The next two SET commands provide the tracking settings for adult zebrafish. These settings can be changed depending on species. Example tracking settings for various model organisms can be found on the tracking settings support page.
- The following two SET commands define parameters for taking an autoreference which is required for tracking.
ACTION MAIN

 AUTOREFERENCE()

 SET(COUNTER1,COUNTER_ZERO)

 LOGCREATE("RUNTIME|TEXT:|TEXT:TRIAL|TEXT:DISTANCE_TRAVELLED")
 LOGRUN()

 WAIT(TIME_BIN)

 INVOKE(SIMPLE_LOCO,TRIALS)

 LOGCREATE("RUNTIME|TEXT:TOTAL_TRIALS|COUNTER1")
 LOGRUN()

COMPLETE
- An autoreference image is made of the arena.
- COUNTER1 is SET to start counting from 0.
- The LOGCREATE and LOGRUN commands can be used to write the headings which will be on the exported data file.
- The LOGCREATE line of code specifies a line of data which comprises a cell with the time the data is processed (RUNTIME), one empty cell (TEXT:|), followed by two text cells (cell 3 contains the text "TRIAL" and cell 4 contains "DISTANCE_TRAVELLED").
- LOGRUN tells the unit to output the data in the .csv data file as specified in the previous LOGCREATE line of code.
- The unit waits for a period of time in seconds DEFINED at the top of the script as TIME_BIN.
- The Action SIMPLE_LOCO is then invoked. This Action, detailed below, repeats the number of times DEFINED at the top of the script as TRIALS.
- After the SIMPLE_LOCO trials are finished the LOGCREATE line specifies a line of data, the 2nd cell contains the text "TOTAL_TRIALS", and the 3rd cell contains the value that COUNTER1 has reached (in this instance the final trial number) and LOGRUN() outputs the data specified in the previous LOGCREATE command.
ACTION SIMPLE_LOCO

 SET(COUNTER1,COUNTER_INC)

 LOGDATA(DATA_SNAPSHOT,"begin")
 WAIT(TIME_BIN)
 LOGDATA(DATA_SNAPSHOT,"end")

 LOGDATA(DATA_SELECT,"begin")
 LOGDATA(DATA_DELTA,"end")

 LOGCREATE("RUNTIME|TEXT:|COUNTER1|ARENA_DISTANCES")
 LOGRUN()

COMPLETE
- COUNTER1 is set to count the trials incrementally each time the Action repeats.
- LOGDATA(DATA_SNAPSHOT,"begin") logs the tracking data of the model organism, and calls this data "begin"
- The unit waits the TIME_BIN as defined in seconds above.
- LOGDATA(DATA_SNAPSHOT,"end") makes another log of the tracking data after the TIME_BIN and calls this data "end"
- The following two LOGDATA lines of code, (DATA_SELECT,"begin") and (DATA_DELTA,"end"), instruct the unit to calculate the difference in data between the two snapshots, "begin" and "end".
- The LOGCREATE line then specify content for a row of data, which includes the runtime this command was made, one empty cell, followed by the value for COUNTER1 (i.e., the trial number) and then distance travelled in the 4th cell (ARENA_DISTANCES).
- LOGRUN() tells the unit to output the data into the .csv file as specified in the previous LOGDATA commands.
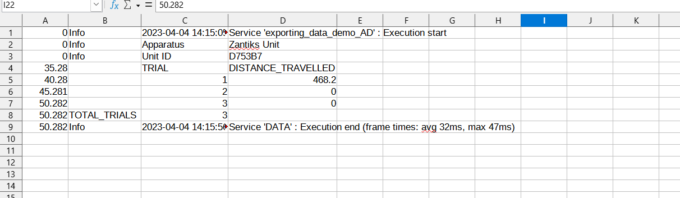
Results output, single arena
The image below illustrates how the results data file details the distance travelled during each trial.
Script download, single arena
Here you can download the exporting data demo script for the LT or AD as a .zs file. Right click on the download link below and download / save the file as a zanscript (.zs) file. Just left clicking on the link will not download it but will open a .txt file in a separate window.
Script download: exporting_data_demo_whole_tank.zs
Assets
As mentioned in the script explanation above, there is no asset loaded at the beginning of the experiment. This is because the entire cage/tank is being used. When an asset is not loaded, the system will default the arena to be the entire camera view. You should however ensure that your system has been calibrated before running experiments. See the Calibrating your Zantiks unit page for details.

