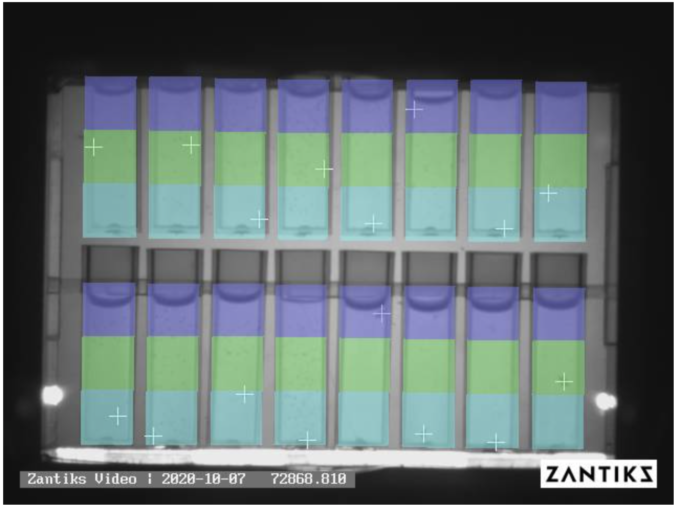
16 Mosquito larvae were transferred into individual cuvettes and placed inside the Zantiks MWP unit. Data on vertical zone use, activity and startle response were automatically recorded live from the unit.
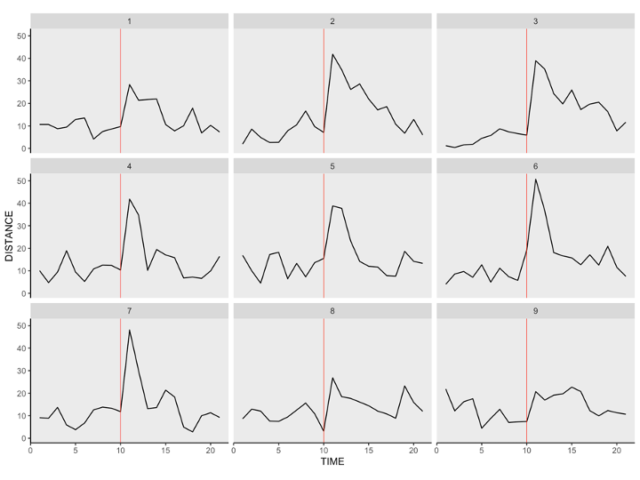
For this practical we have 24 of these 21 seconds videos that show the response of larvae to a vibrational stimulus of 500ms which is indicated by a red light in the top left corner of the video.
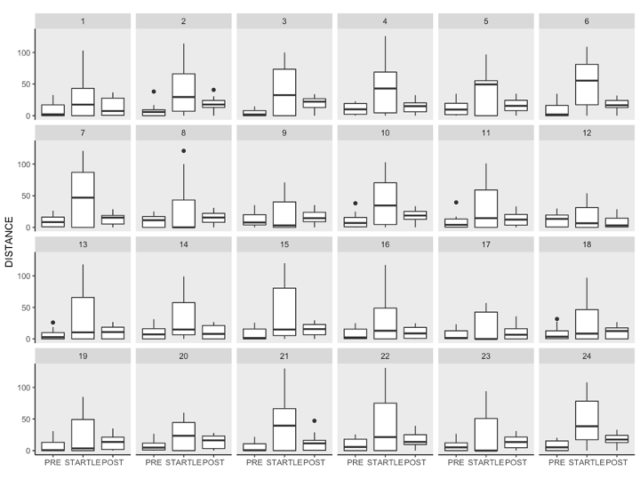
Additionally, we have another 24 video recordings which are 20 minutes long of baseline activity and vertical distribution without any startle stimuli.
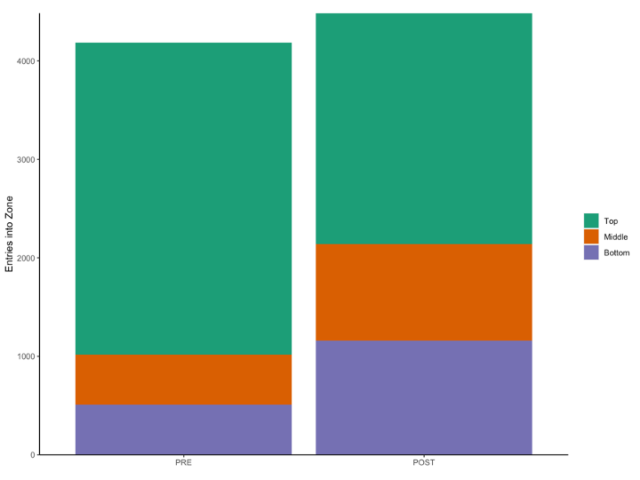
Together with these videos, we have data files with their corresponding data on time spent in the upper, middle and lower thirds of the cuvette (3 zones), the distance travelled, and the numbers of visits to each zone within the second.
Mosquito larvae responding to a vibrational startle in the Zantiks MWP unit
Potential Learning Outcomes
- To gain understanding of vertical distribution in aquatic organisms
- To gain understanding of the startle response or startle reflex in animals
- To gain understanding of habituation to stimuli (or lack of) and discuss how this may help or hinder ecological processes
- To gain practical experience in coding animal behaviours from video data
- To gain experience in handling large data sets from automatically generated behavioural data
- To compare and contrast manual versus automatically generated behavioural data and understand the pros and cons of both methods
- To understand how to apply appropriate statistical analysis to a dataset
- To understand the importance of generating baseline data on animal behaviours
Potential data Output
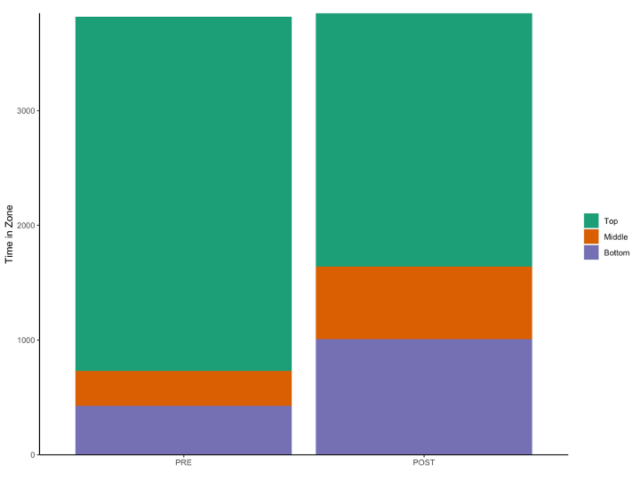
Here you will find:
Full methodology and supporting media
Startle data with corresponding videos
Baseline data with corresponding videos

